---
title: "Trends in Public School Enrolment in Ontario"
author: "Simon Kiss"
date: "2026-10-07"
draft: false
categories: []
code-tools: true
bibliography: references.bib
execute:
  echo: false
  warning: false
  message: false
---

```{r}
#| label: setup
library(tidyverse)
library(here)
```

## Introduction

A while back I looked at the trends in public school enrolment in Ontario ([link](https://sjkiss.github.io/posts/2021-11-15-private-and-public-school-enrolment-in-ontario/)), and I thought it would be interesting to revisit this topic and see how things have changed over time. However to do this, it was necessary to cobble data together from two different datasets. Statistics Canada reports private and public school enrolment up until 2023-2024 [here](https://www150.statcan.gc.ca/t1/tbl1/en/tv.action?pid=3710017401) but that doesn't distinguish between public and Catholic systems.

```{r}
#| label: load-cansim
#| eval: true
#install.packages("cansim")
library(cansim)
#search_cansim_cubes("Number of students")

```

```{r}
#| label: get-private-school-enrolment
private_school_enrolment<-get_cansim("37-10-0173")
private_school_enrolment |>
  filter(GEO=="Ontario") |> filter(str_detect(Grade, "Total")) |>
  filter(str_detect(Sex, "Total")) |>
  # cansim dates each school year by July 1 of the year it ends,
  # e.g. 2011/2012 -> 2012-07-01. The count itself is taken in September.
  select(`School Year End`=Date, Number=VALUE) |>
  mutate(Category=rep("Private", n()))->private_school_enrolment
```

My own view is that is an important distinction, as this is one of the few areas where parents can exercise some discretion about where to send their children. Concerns about quality in one, might show up in enrolment shifts between the two.

Ontario, however, does publish this information, in a slightly less usable format, [here](https://data.ontario.ca/dataset/ontario-public-schools-enrolment).

```{r}
#| label: scrape-public-school-enrolment
library(jsonlite)
library(readxl)
# List every file in the Ontario Open Data "Ontario public schools enrolment" dataset
# (https://data.ontario.ca/dataset/ontario-public-schools-enrolment)
# and keep the English Excel table for each academic year
ontario_enrolment_resources<-fromJSON("https://data.ontario.ca/api/3/action/package_show?id=ontario-public-schools-enrolment")$result$resources |>
  filter(format=="XLSX", language=="english") |>
  mutate(`Academic Year`=str_extract(name, "\\d{4}-\\d{4}")) |>
  select(`Academic Year`, url) |>
  arrange(`Academic Year`)
# Download each year once, then read and stack them. Every year has the same
# columns: Board Number, Board Name, School Number, School Name, School Level,
# School Type, School Language, Enrolment
enrolment_dir<-here("posts/2026-10-07-trends-in-public-school-enrolment-in-ontario/data")
dir.create(enrolment_dir, showWarnings=FALSE)
read_enrolment_year<-function(year, url) {
  file<-file.path(enrolment_dir, basename(url))
  if (!file.exists(file)) download.file(url, file, mode="wb", quiet=TRUE)
  read_excel(file, sheet=1, col_types="text") |>
    mutate(`Academic Year`=year)
}
map2(ontario_enrolment_resources$`Academic Year`, ontario_enrolment_resources$url, read_enrolment_year) |>
  list_rbind() |>
  # Drop the provincial total row at the bottom of each sheet
  filter(!is.na(`School Number`)) |>
  # Schools with fewer than 10 students are reported as "<10"; set them to 5
  mutate(Enrolment=if_else(Enrolment=="<10", 5, parse_number(Enrolment)),
         `School Type`=recode(`School Type`, "Roman Catholic"="Catholic"))->public_school_enrolment_by_school

```

```{r}
#| label: mutate-public-school-enrolment
#head(public_school_enrolment_by_school)
public_school_enrolment_by_school |>
  group_by(`School Type`, `School Language`, `Academic Year`) |>
  summarise(Number=sum(Enrolment)) |>
  ungroup() |>
  # Date each school year the way cansim dates StatCan's: July 1 of the year
  # it ends (2011-2012 -> 2012-07-01), so the two sources line up. The count
  # itself is taken in October, at the start of the school year.
  mutate(`School Year End`=as.Date(paste0(str_sub(`Academic Year`, 6, 9), "-07-01"))) |>
  select(-`Academic Year`) |>
  rename(Category=`School Type`)->public_school_enrolment_type


```

```{r}
#| label: combine
private_school_enrolment |>
  bind_rows(public_school_enrolment_type) |>
  # Keep only the school years both sources cover (2011/12 to 2023/24)
  filter(between(`School Year End`, as.Date("2012-07-01"), as.Date("2024-07-01"))) |>
  group_by(`School Year End`, Category) |>
  summarise(Number=sum(Number)) |>
  group_by(`School Year End`) |>
  mutate(Category_percent=Number/sum(Number)*100) |>
  ungroup() |>
  # Readable label for each school year, e.g. 2012-07-01 -> "2011-12"
  mutate(`School Year`=paste0(year(`School Year End`)-1, "-", str_sub(year(`School Year End`), 3, 4)))->ontario_school_enrolment_catholic_public

```

## Public - Private and English - French Shifts

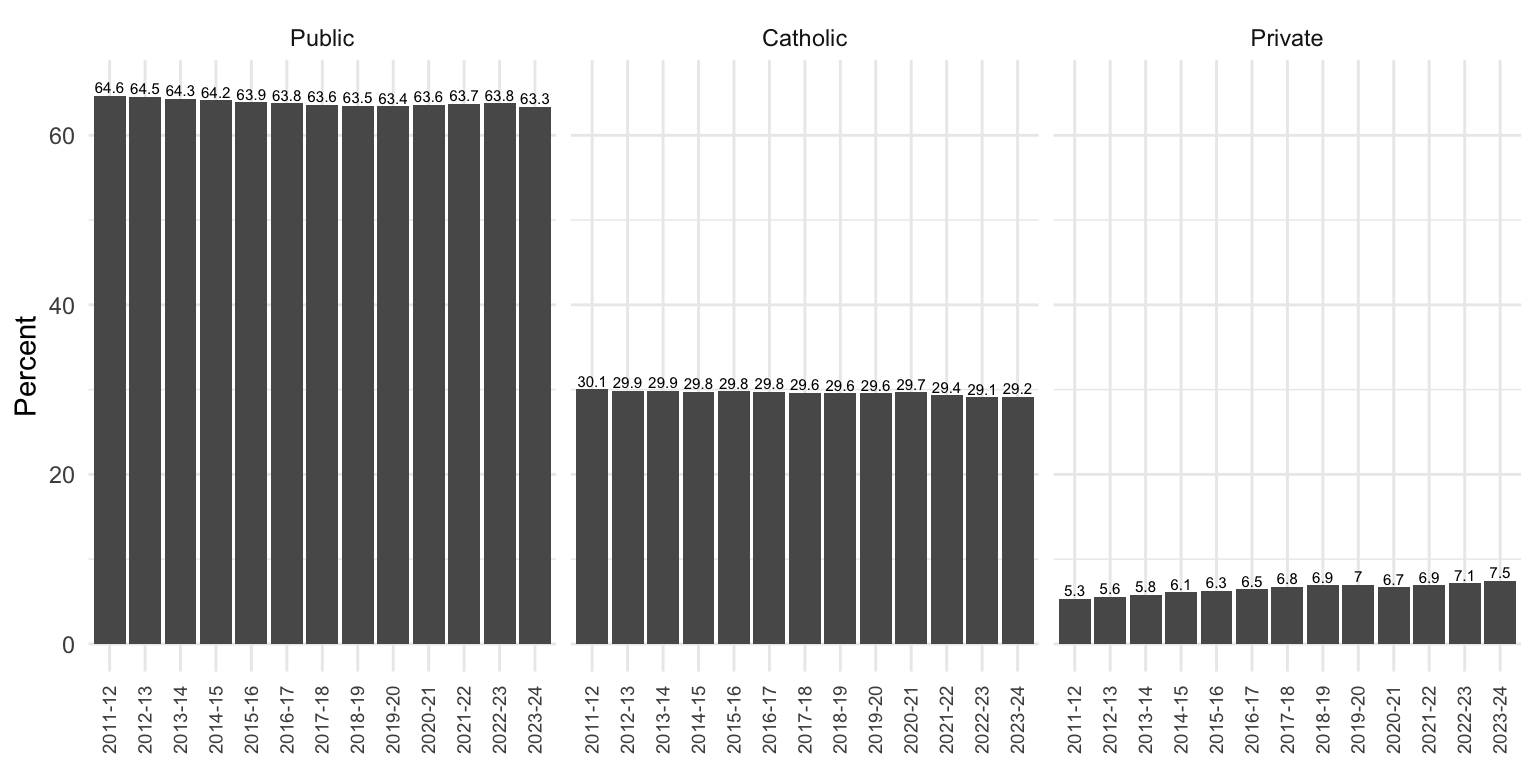
If we combine the two datasets, we end up with a proportional distribution that looks like this (@fig-draw-plot).

```{r}
#| label: fig-draw-plot
#| fig.width: 8
#| fig.height: 4
#| fig.cap: "Distribution of Ontario school enrolment (Kindergarten to Grade 12). Source: Statistics Canada Table 37-10-0173 for private school and Ontario Open Data catalogue for all others."
ontario_school_enrolment_catholic_public |>
  filter(str_detect(Category, "Protestant", negate=T)) |>
  ggplot(aes(x=`School Year`, y=Category_percent))+geom_col()+facet_grid(~fct_relevel(Category, "Public", "Catholic", "Private"))+theme_minimal()+geom_text(aes(x=`School Year`, y=Category_percent+1, label=round(Category_percent,1)), size=2)+
  labs(x=NULL, y="Percent")+
  theme(axis.text.x=element_text(angle=90, vjust=0.5, hjust=1, size=7))


```

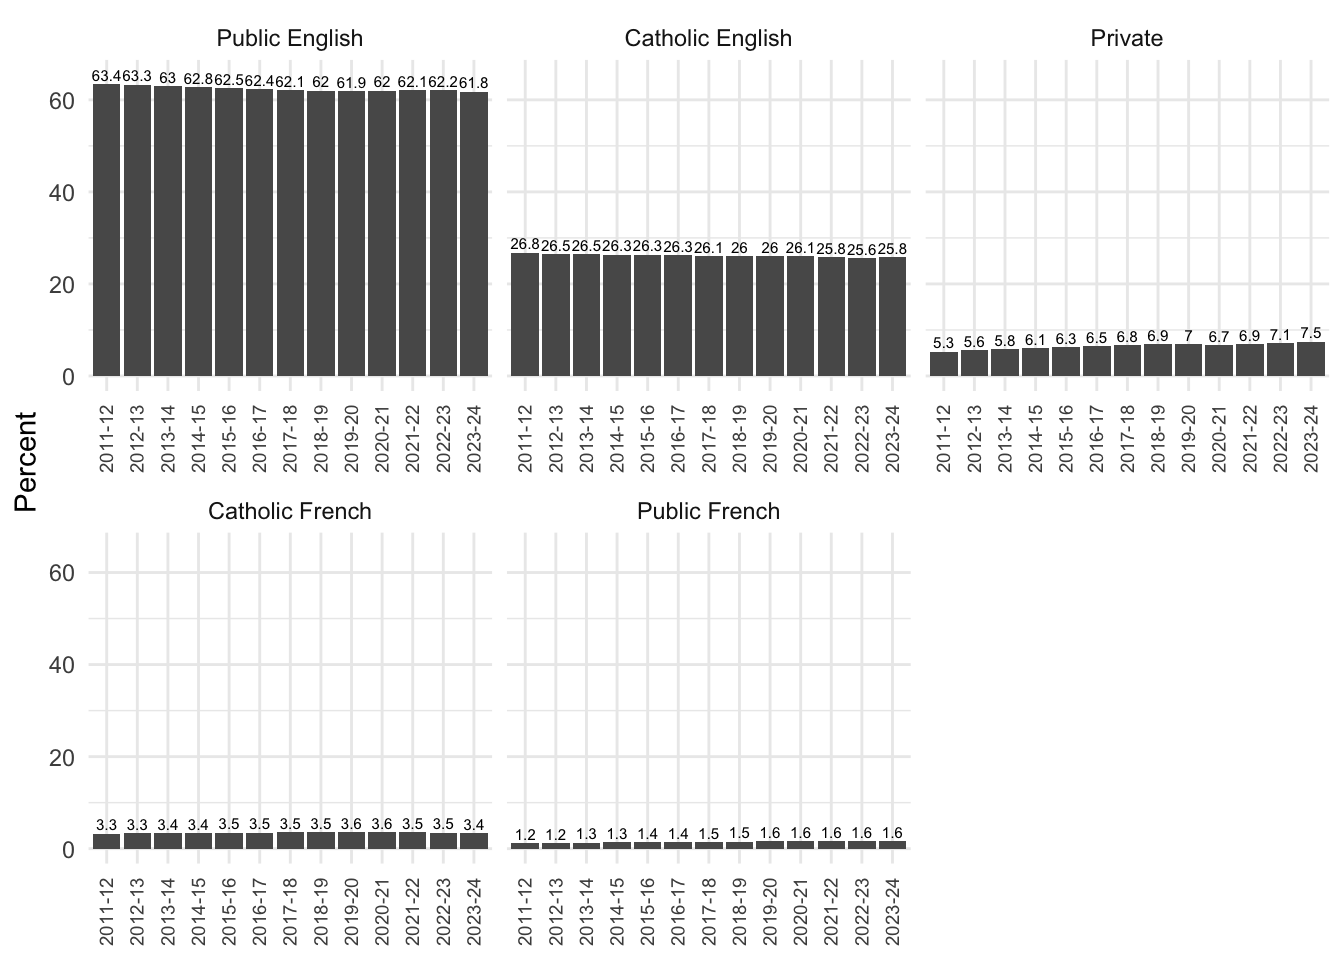
We can also go a bit further and break the boards out by language as well (@fig-plot-language). This is a another element of choice that parents can exercise, albeit probably harder than choosing between Catholic and public systems. To be clear, the French schoolboards in Ontario are *not* French immersion, they are *French*. All instruction (save for English) is in French, the language of administration is French and parents. Non-francophone parents can choose to send their children there, but, if the parents were not educated in French, then it is the discretion of the principal about whether or not to accept the pupil, but non-francophone parents *can* send their children to be educated in French.

This is actually revealing. The drop in the public system from 64.6% in 2011-12 to 63.3% (1.3 percentage point drop) in 2023-24 that was observed *without* distinguishing by language *grows* when breaking out the French public board. It goes from 63.4% to 61.8% (1.6 percentage point drop) in 2023-24. On the Catholic side, a similar thing is happening although at a slower rate, a 0.9 percentage point drop without considering language becomes a 1 percentage point drop when taking into account language. It is primarily the French public board that is the beneficiary of this, going from 1.2% to 1.6% of students over this time period.

```{r}
#| label: breakout-language
private_school_enrolment |>
  bind_rows(public_school_enrolment_type) |>
  # Keep only the school years both sources cover (2011/12 to 2023/24)
  filter(between(`School Year End`, as.Date("2012-07-01"), as.Date("2024-07-01"))) |>
  group_by(`School Year End`, Category, `School Language`) |>
  summarise(Number=sum(Number)) |>
  group_by(`School Year End`) |>
  mutate(Category_percent=Number/sum(Number)*100) |>
  ungroup() |>
  # Readable label for each school year, e.g. 2012-07-01 -> "2011-12"
  mutate(`School Year`=paste0(year(`School Year End`)-1, "-", str_sub(year(`School Year End`), 3, 4)))->ontario_school_enrolment_language
# Combine the board names and language for comparison
ontario_school_enrolment_language |>
  mutate(Category=paste(Category, `School Language`)) |>
  mutate(Category=str_remove_all(Category, " NA"))->ontario_school_enrolment_language
```

```{r}
#| label: fig-plot-language
#| fig.width: 7
#| fig.height: 5
#| fig.cap: "Distribution of Ontario school enrolment by board and language of instruction (Kindergarten to Grade 12). Source: Statistics Canada Table 37-10-0173 for private school and Ontario Open Data catalogue for all others."
ontario_school_enrolment_language |>
    filter(str_detect(Category, "Protestant", negate=T)) |>
  ggplot(aes(x=`School Year`, y=Category_percent))+geom_col()+facet_wrap(~fct_relevel(Category,"Public English", "Catholic English",  "Private", "Catholic French","Public French"), scales="free_x")+theme_minimal()+geom_text(aes(x=`School Year`, y=Category_percent+2, label=round(Category_percent,1)), size=2)+
  labs(x=NULL, y="Percent")+
  theme(axis.text.x=element_text(angle=90, vjust=0.5, hjust=1, size=7))

```

One interesting thing that I see there is what happened during the COVID-19 pandemic. As much as there is a perceptible shift *away* from the English public system toward the French public and the private system, this was briefly interrupted by the COVID-19 pandemic. The school year 2019-2020 was interrupted most severely in Ontario because of the first wave of the pandemic; that was the first shutdown in March which continued to the end of the school year. In the *following* year - 2020-2021 - there was an *increase* in enrolment in the English public system and a *drop* in the private school system in Ontario. But then, the enrolment patterns reverted to trend, and the rise in students enrolled in private schools increased. I don't know what explains that slight bump.

## Board-by-Board Analysis

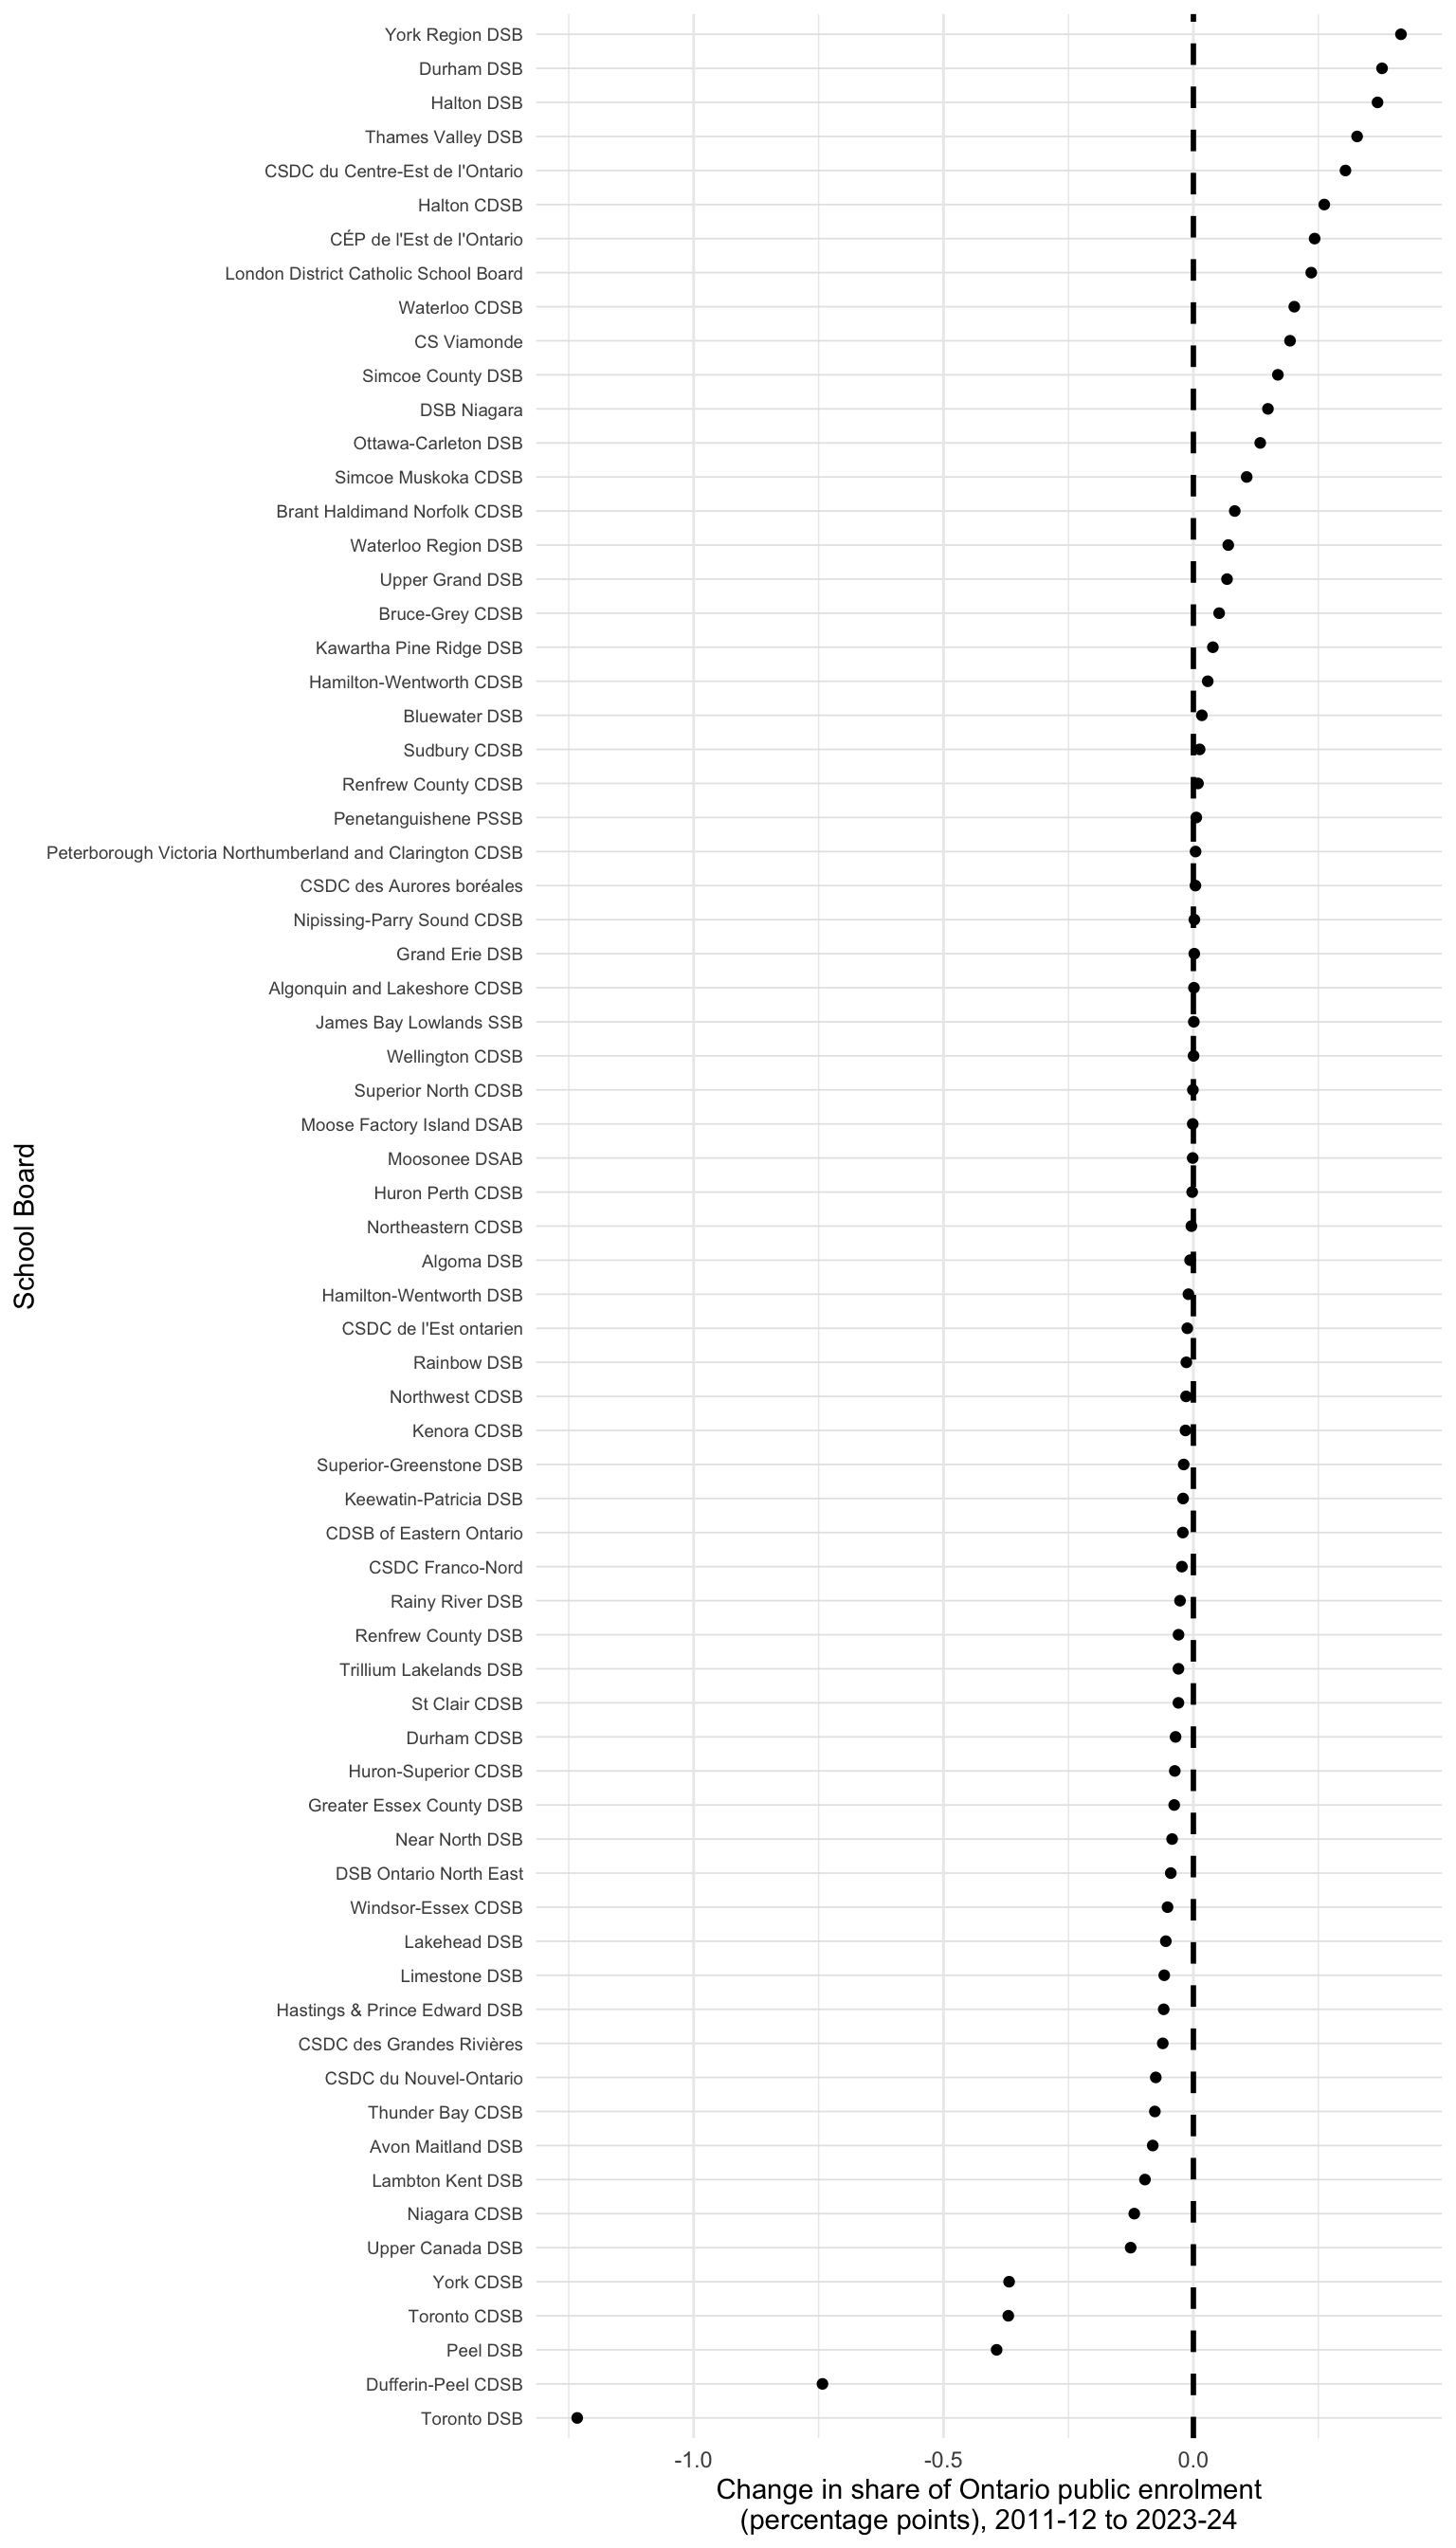
We can also try to pinpoint which boards are gaining student share and which are losing student share. The following graph plots the percentage of students in each board for 2011-2012 and 2023-2024 and then subtracts the former for the latter. Note, this is going to confound population shifts in that time with any story of board quality or student choice.

```{r}
#| label: fig-board-by-board
#| fig.width: 8
#| fig.height: 14
#| fig.cap: "Ontario public school boards by change in enrolment share, 2011-2012 and 2023-2024."
public_school_enrolment_by_school |>
  group_by(`Academic Year`, `Board Name`, `School Type`, `School Language`) |>
  summarise(n=sum(Enrolment)) |>
  group_by(`Academic Year`) |>
  # Each board's share of all Ontario public enrolment that year, in percent
  mutate(Percent=n/sum(n)*100) |>
  filter(`Academic Year`=="2011-2012"|`Academic Year`=="2023-2024") |>
  arrange(`Board Name`) |>
group_by(`Board Name`) |>
  mutate(Delta=Percent-lag(Percent)) |>
  arrange(desc(Delta)) |>
  ungroup() |>
  filter(!is.na(Delta)) |>
  ggplot(aes(x=Delta, y=fct_reorder(as.factor(`Board Name`), Delta)))+geom_point()+labs(x="Change in share of Ontario public enrolment\n(percentage points), 2011-12 to 2023-24", y="School Board")+theme_minimal()+
  # One line per board: smaller names, with faint guides from each name to its point
  theme(axis.text.y=element_text(size=7),
        panel.grid.major.y=element_line(colour="grey90", linewidth=0.3))+geom_vline(xintercept=0, linewidth=1, linetype=2)
```

What this shows to me is the hollowing out of the City of Toronto! Economist, commentator and housing expert, Mike Moffatt has pointed out the dramatic emigration of families with children from the City of Toronto [link](https://www.theglobeandmail.com/opinion/editorials/article-young-families-moving-away-from-toronto-editorial/) and this chart bears it out. The TDSB has a 1.2 percentage point smaller share of Ontario public school students than it did in 2011-2012. Now this figure does not take into account the *size* of these boards.

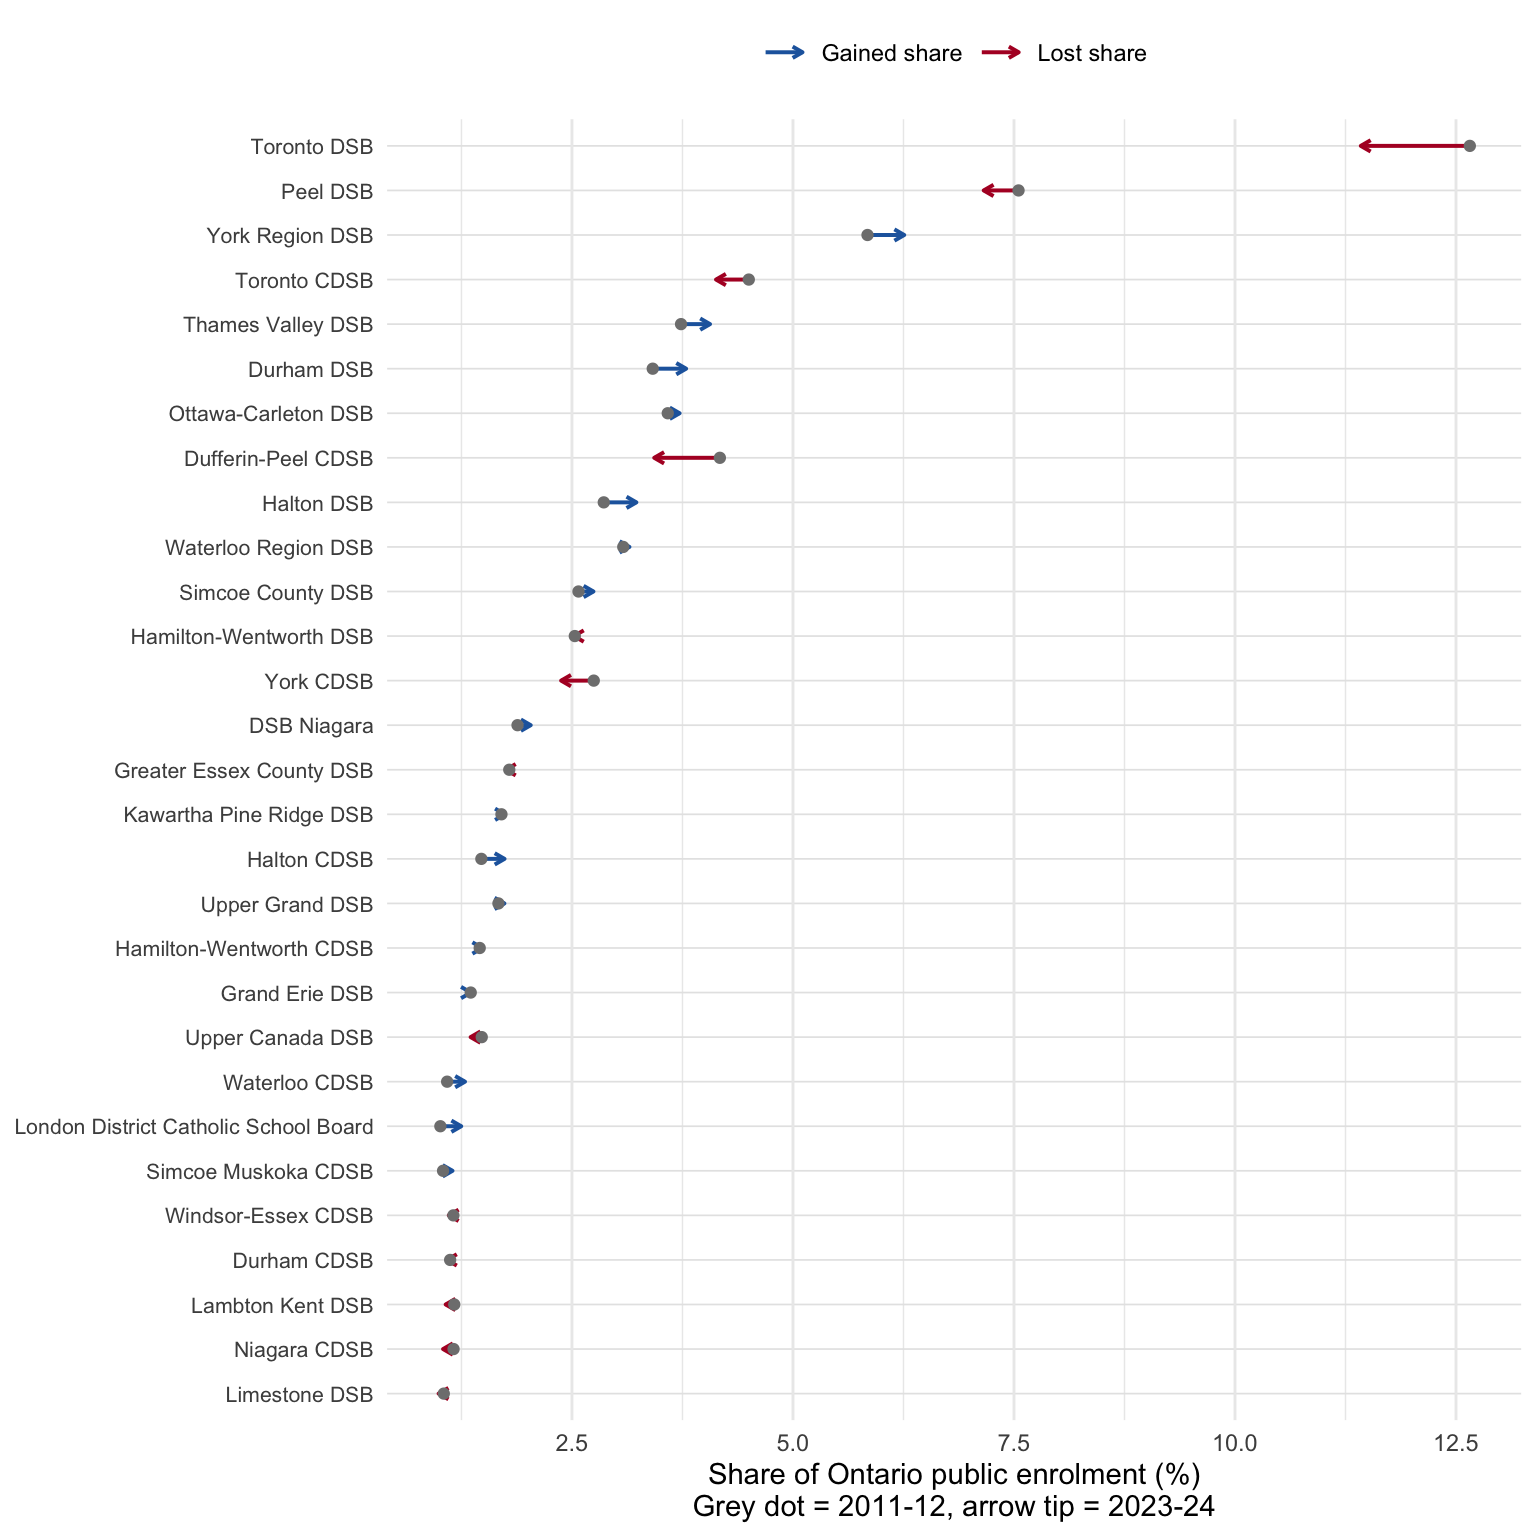
@fig-board-dumbbell puts these changes in context for the larger boards, specifically, only the ones with more than 1% of Ontario public school students in 2011-12. Each arrow runs from the board's share in 2011-12 to its share in 2023-24.

```{r}
#| label: fig-board-dumbbell
#| fig.width: 8
#| fig.height: 8
#| fig.cap: "Share of Ontario public school enrolment, 2011-12 and 2023-24, for boards with more than 1% of enrolment in 2011-12."
public_school_enrolment_by_school |>
  filter(`Academic Year` %in% c("2011-2012", "2023-2024")) |>
  group_by(`Academic Year`, `Board Name`) |>
  summarise(n=sum(Enrolment)) |>
  # Each board's share of all Ontario public enrolment that year, in percent
  mutate(Share=n/sum(n)*100) |>
  ungroup() |>
  select(-n) |>
  pivot_wider(names_from=`Academic Year`, values_from=Share) |>
  filter(`2011-2012`>1, !is.na(`2023-2024`)) |>
  mutate(Direction=if_else(`2023-2024`>=`2011-2012`, "Gained share", "Lost share"),
         `Board Name`=fct_reorder(`Board Name`, `2023-2024`))->board_shares_large

board_shares_large |>
  ggplot(aes(y=`Board Name`))+
  geom_segment(aes(x=`2011-2012`, xend=`2023-2024`, yend=`Board Name`, colour=Direction),
               arrow=arrow(length=unit(0.15, "cm")), linewidth=0.7)+
  geom_point(aes(x=`2011-2012`), colour="grey50", size=1.5)+
  scale_colour_manual(values=c("Gained share"="#2166ac", "Lost share"="#b2182b"))+
  labs(x="Share of Ontario public enrolment (%)\nGrey dot = 2011-12, arrow tip = 2023-24", y=NULL, colour=NULL)+
  theme_minimal()+
  theme(axis.text.y=element_text(size=8), legend.position="top",
        panel.grid.major.y=element_line(colour="grey90", linewidth=0.3))
```

## Conclusion

There is an ongoing shift away from the public and Catholic English school school boards towards (primarily) private schools and (secondarily) to the French boards. These patterns might be driven by parents exercising their right of exit in a context of a near-monopoly on a public service. As the economist Albert O. Hirschman [@hirschmanexit1970]. The most recent results from the international PISA programme of education assessment reports that Canadian results are the lowest ever recorded, even as they are higher than the OECD average [link](https://www.oecd.org/content/dam/oecd/en/publications/reports/2026/09/pisa-2025-results-volume-i-country-notes_88d1164e/canada_71a0d70b/aa03e78f-en.pdf)

On the other hand, there are also profound shifts going on in the distribution of Ontario students that are clearly related to population shifts. Remote and northern boards are losing student share, as are those boards in the heart of the GTHA, where housing costs are the steepest and where it is the most expensive to raise children.

## Appendix

For reference and reproducibility, the full numbers for the public boards and the private school enrolment shares are here, in @tbl-print-numbers.

```{r}
#| label: tbl-print-numbers

library(DT)

ontario_school_enrolment_language |>
  select(`School Year`, Category, Number, Percent=Category_percent) |>
  datatable() |>
  formatRound('Percent', 1)


```

All of the code needed to reproduce this post, from downloading the data to drawing the figures, is available [here](https://github.com/sjkiss/sjkiss.github.io/blob/main/posts/2026-10-07-trends-in-public-school-enrolment-in-ontario/index.qmd). You can also view it with the **Code** button at the top of this page.

### Statement on use of LLMs

I used Claude Code (Opus 5.5) iteratively to assist in downloading, merging, cleaning and plotting the data.

## References